
Welcome to the RPAG Quarterly Market Review for Q4 2023, where we discuss U.S. equity markets, international equities, the broad U.S. fixed income market, the Magnificent Seven, and much more.
Presenter:- Jeff Elvander, Chief Investment Officer
Summary
The equity and fixed income markets experienced very strong positive fourth-quarter performance. U.S. equity rose 12.1% (Russell 3000), with large-cap tech stocks leading the way. For the year, large-cap growth has outperformed large-cap value by over 3100 basis points (42.7% vs. 11.5%). International equities rose to a lesser extent over the quarter, posting a 9.8% gain (MSCI ACWI ex. U.S.). The broad U.S. fixed income market was also up, returning 6.8% (Bloomberg Barclays aggregate) over the quarter. While the Fed likely finished raising rates, there was no indication of a rate cut, which is what market participants anticipate in 2024. This is dependent on the inflationary outlook and health of the economy, which the Fed has been closely monitoring. The U.S. labor market remained tight during the quarter, with unemployment at 3.7% in December.
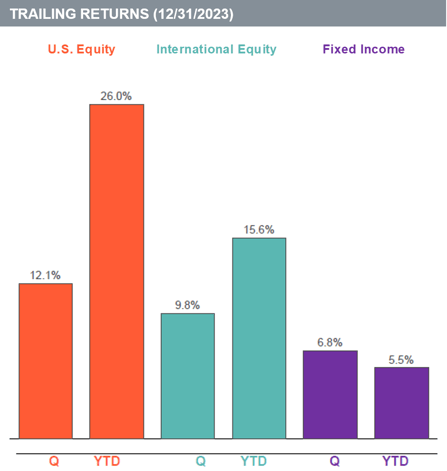
Quarterly and year-to-date returns of the following indices: U.S. Equity (Russell 3000 Index), Fixed Income (Bloomberg Barclays U.S. Aggregate Bond Index), and International Equity (MSCI ACWI ex U.S. Index).
U.S. Equity
- The broad U.S. equity market, as measured by the Russell 3000 Index, was up 12.1% for the quarter.
- The best-performing U.S. equity index for the quarter was Russell 2000 Value, returning a positive 15.3%.
- The worst-performing U.S. equity index for the quarter was Russell 1000 Value, returning a positive 9.5%.
Over the last year, growth stocks outperformed value stocks by 31.20%. For the trailing quarter, growth stocks outperformed value stocks by 4.70%.
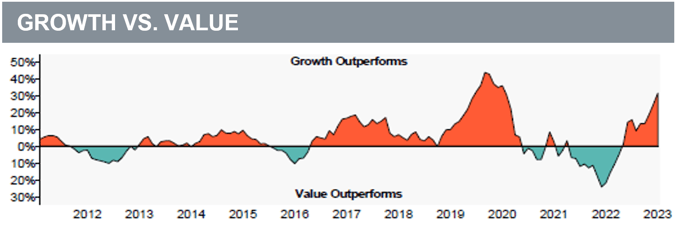
The graph above is plotted using a rolling one-year time period. Growth stock performance is represented by the Russell 1000 Growth Index. Value stock performance is represented by the Russell 1000 Value Index.
International Equity
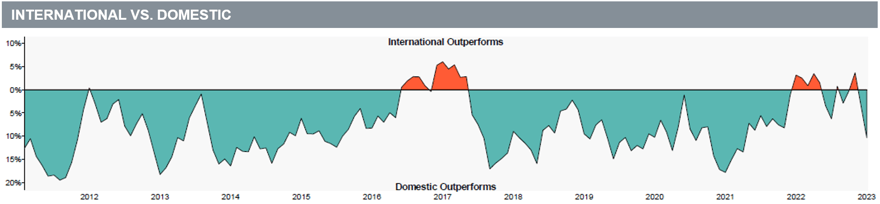
- Developed international equity returned a positive 10.5% in the last quarter (MSCI EAFE).
- Emerging market equity posted a positive 7.9% return (MSCI Emerging Markets Index).
Over the last year, developed international stocks outperformed emerging market stocks by 9.10%. For the trailing quarter, developed international stocks outperformed emerging market stocks by 2.60%.
Fixed Income
- The broad U.S. fixed income market returned a positive 6.8% (Bloomberg Barclays U.S. Aggregate) for the quarter.
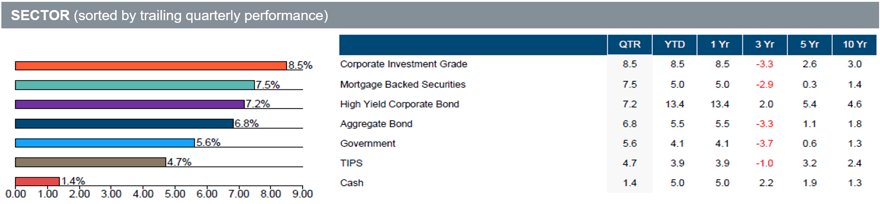
- The best performing sector for the quarter was Corporate Investment Grade, returning a positive 8.5%.
- The worst performing sector for the quarter was Cash, returning a positive 1.4%.
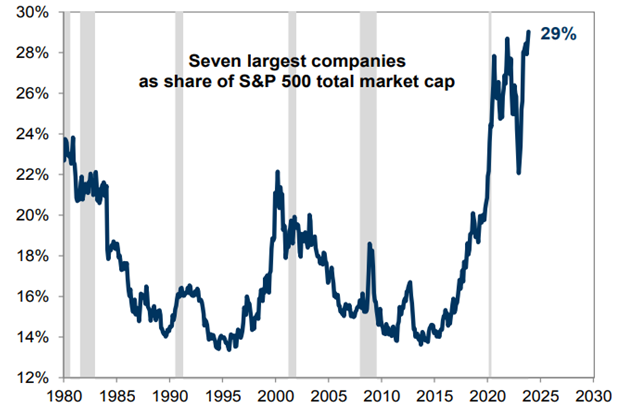
The Magnificent Seven
The Magnificent Seven (Apple, Amazon, Alphabet, Microsoft, Meta, NVIDIA, and Tesla) were responsible for the lion’s share of the U.S. equity market’s performance in 2023. This group of stocks now represents approximately 1/3 of the S&P 500 Index. With the market narrowing around these names, they will exert much greater influence on the market’s performance in 2024, as market-cap weighted indices like the S&P 500 are starting the year much less diversified than they have in the past.
Download a copy of this market review document by clicking here, or contact us at the email address below.
________________________________________
Looking for more information?
Contact the RPAG Support Team at support@rpag.com to learn more about RPAG and get help with our platform, suite of services, next-gen technology, or anything else!