
Welcome to the RPAG Quarterly Market Review for Q1 2024, where we discuss U.S. equity markets, international equities, the broad U.S. fixed income market, inflation trends, and much more.
Presenter:- Jeff Elvander, CFA, Chief Investment Officer
Summary
U.S. Equities continued to march higher, returning 10.0 % (Russell 3000) over the quarter. Growth stocks continued to outperform value stocks, with growth outperforming value by over 1800 basis points over the latest one-year time period. International equities rose to a lesser extent, posting a 4.7% return (MSCI ACWI ex U.S) over the quarter. The broad U.S. fixed income market was down over the quarter as rates rose, producing a negative 0.8% return (Bloomberg Barclays Aggregate.) The Fed held interest rates steady. Investors are anticipating the Fed to lower rates in 2024, though expectations on the number of rate cuts were slowly being scaled back. The U.S. labor market remained tight during the quarter with unemployment at 3.8% in March.
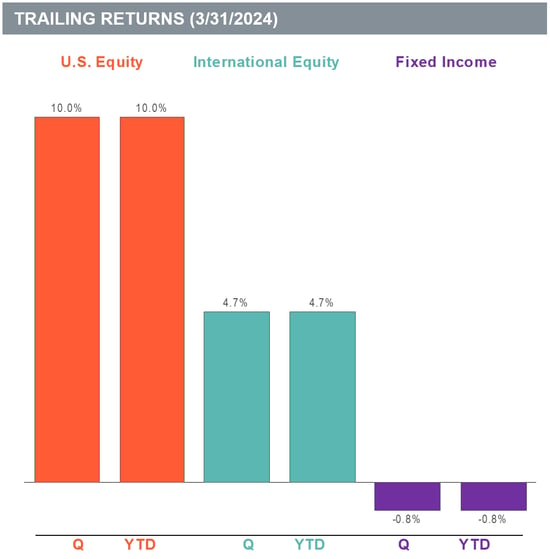
Quarterly and year-to-date returns of the following indices: U.S. Equity (Russell 3000 Index), Fixed Income (Bloomberg Barclays U.S. Aggregate Bond Index), and International Equity (MSCI ACWI ex U.S. Index).
U.S. Equity
- The broad U.S. equity market, as measured by the Russell 3000 Index, was up 10% for the quarter.
- The best performing U.S. equity index for the quarter was Russell 1000 Growth, returning a positive 11.4%.
- The worst performing U.S. equity index for the quarter was Russell 2000 Value, returning a positive 2.9%.
Over the last year, growth stocks outperformed value stocks by 18.70%. For the trailing quarter, growth stocks outperformed value stocks by 2.40%.
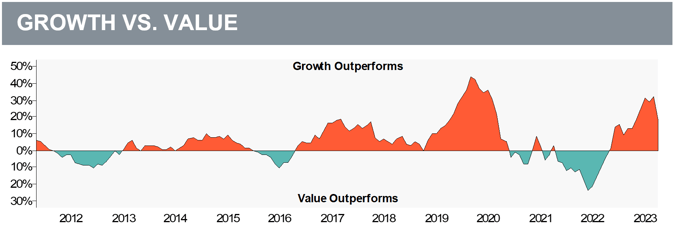
The graph above is plotted using a rolling one-year time period. Growth stock performance is represented by the Russell 1000 Growth Index. Value stock performance is represented by the Russell 1000 Value Index.
International Equity
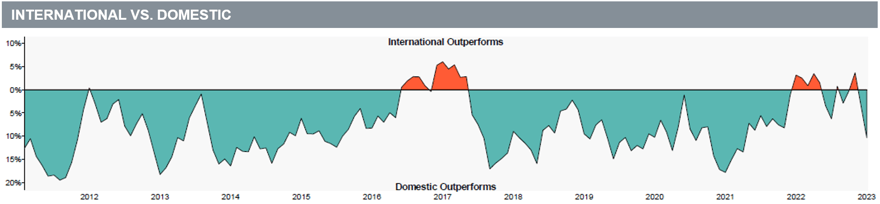
- Developed international equity returned a positive 5.9% in the last quarter (MSCI EAFE).
- Emerging market equity posted a positive 2.4% return (MSCI Emerging Markets Index).
Over the last year, developed international stocks outperformed emerging market stocks by 7.70%. For the trailing quarter, developed international stocks outperformed emerging market stocks by 3.50%.
Fixed Income
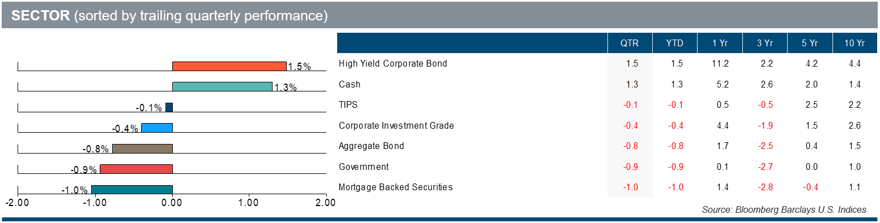
- The broad U.S. fixed income market returned a negative 0.8% (Bloomberg Barclays U.S. Aggregate) for the quarter.
- The best performing sector for the quarter was High Yield Corporate Bond, returning a positive 1.5%.
- The worst performing sector for the quarter was Mortgage Back Securities, returning a negative 1%.
Inflation: Current vs. Historical
Inflation, as measured by both Core and Headline CPI, is now below its historical 50-year average. Despite past inflationary spikes marked with subsequent recessions, the current period of Fed rate hikes has helped bring inflation down. Coupled with continued GDP growth, we are in a spot often referred to as a “soft landing” for the economy.
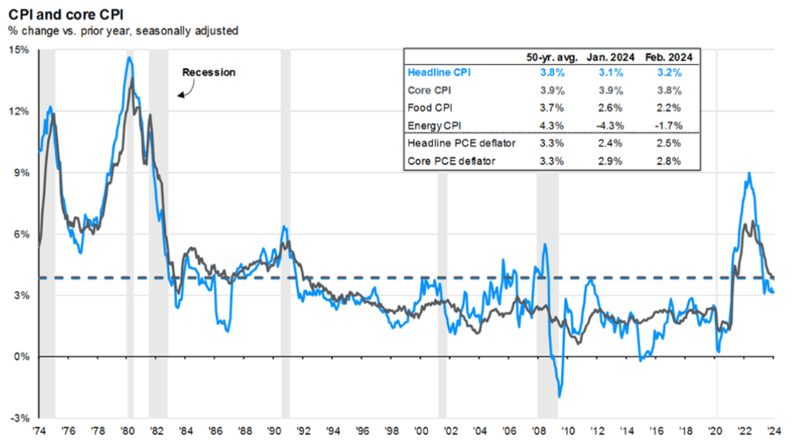
Source: BLS, FactSet, J.P. Morgan Asset Management
Download a copy of this market review document by clicking here, or contact us at the email address below.
________________________________________
Looking for more information?
Contact the RPAG Support Team at support@rpag.com to learn more about RPAG and get help with our platform, suite of services, next-gen technology, or anything else!