
Welcome to RPAG Quarterly Market Review for Q2 2023 where we discuss U.S. equity markets, international equities, broad U.S fixed income market, and much more.
Presenter:
- Jeff Elvander, Chief Investment Officer
Summary
U.S. equity markets rallied in the second quarter, rising 8.4% (Russell 3000) on continued moderating inflation. The Consumer Price Index (CPI) peaked last June and has since come down. International equities rose to a lesser extent, posting a 2.4% gain over the quarter (MSCI ACWI ex U.S.). The broad U.S. fixed income market returned -0.8% (Bloomberg Barclays Aggregate) over the quarter. The U.S. labor market remained tight during the quarter with unemployment at 3.6% in June. Large cap growth stocks had a strong quarter, with the Russell 1000 Growth up 12.8% and outperformed the Russell 1000 Value by over 8 percentage points. The Federal Reserve raised interest rates 25 basis points during the second quarter. The Fed will continue to analyze incoming data on inflation in deciding whether to continue its interest rate hiking regime.
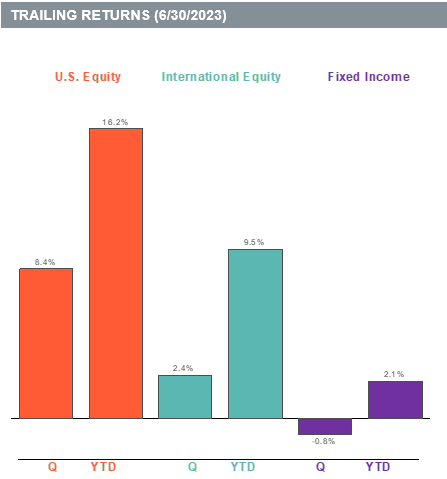
Quarterly and year-to-date returns of the following indices: U.S. Equity (Russell 3000 Index), Fixed Income (Bloomberg Barclays U.S. Aggregate Bond Index) and International Equity (MSCI ACWI ex U.S. Index)
U.S. Equity
- The broad U.S. equity market, as measured by the Russell 3000 Index, was up 8.4% for the quarter.
- The best performing U.S. equity index for the quarter was Russell 1000 Growth, returning a positive 12.8%.
- The worst performing U.S. equity index for the quarter was Russell 2000 Value, returning a positive 3.2%.
Over the last year, growth stocks outperformed value stocks by 15.60%. For the trailing quarter, growth stocks outperformed value stocks by 8.70%.
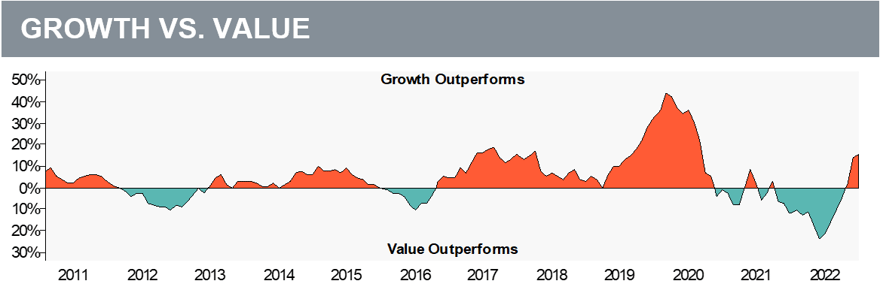
The graph above is plotted using a rolling one-year time period. Growth stock performance is represented by the Russell 1000 Growth Index. Value stock performance is represented by the Russell 1000 Value Index.
International Equity
- Developed international equity returned a positive 3.2% in the last quarter (MSCI EAFE).
- Emerging market equity posted a positive 0.9% return (MSCI Emerging Markets Index).
Over the last year, developed international stocks outperformed emerging market stocks by 17.70%. For the trailing quarter, developed international stocks outperformed emerging market stocks by 2.30%.
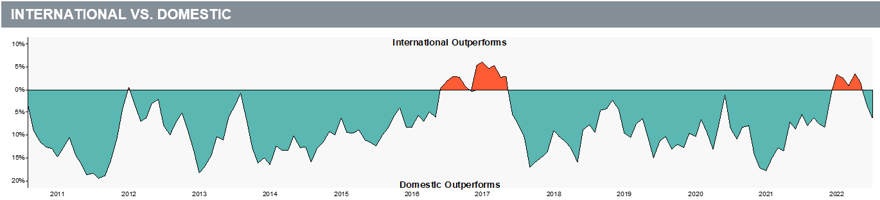
The graph above is plotted using a rolling one-year time period. International stock performance is represented by the MSCI ACWI ex U.S. Index. Domestic stock performance is represented by the Russell 3000 Index.
Fixed Income
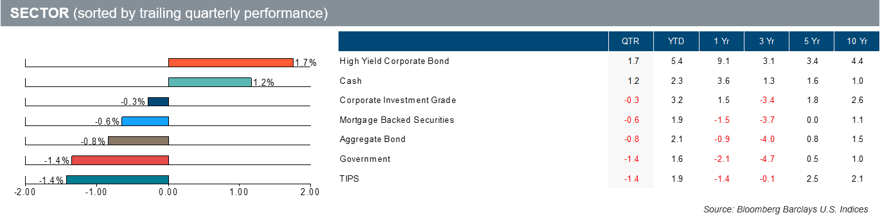
- The broad U.S. fixed income market returned a negative 0.8% (Bloomberg Barclays U.S. Aggregate) for the quarter.
- The best performing sector for the quarter was High Yield Corporate Bond, returning a positive 1.7%.
- The worst performing sector for the quarter was TIPS, returning a negative 1.4%.
Download a copy of this market review document by clicking here, or contact us at the email address below.
________________________________________
Looking for more information?
Contact the RPAG Support Team, support@rpag.com, to learn more about RPAG and get help with our Platform, or anything else!